.png)
Using the Currency Strength Meter in your trading.
- Erica Lorrai
- Nov 1, 2025
- 3 min read

Updated: Mar 23
Here’s how to avoid bad trades and choose better ones
What does the Currency Strength Meter show me?
This indicator ranks relative currency strength over a recent window — usually short-term.
Read the following with a real chart example to learn how to use currency strength meter in your trading.

How to read this:
Higher number = stronger currency
Lower number = weaker currency
It’s relative, not absolute
It updates as price moves
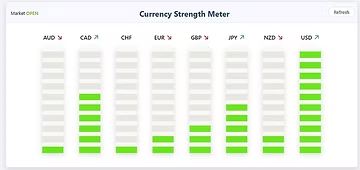
So in plain English, right now:
USD is strong
CAD is strong
JPY is gaining
AUD is weak
EUR is weak
What the Currency Strength Meter is NOT
Important, because this is where people mess up:
The Strength Meter is not
a trade signal
a “buy the top number”
a timing tool
a standalone system
If you try to trade off this alone, you will get checked.
What it actually does
It answers one question
“Which currency is being accumulated, and which is being distributed right now?”
How YOU should use it (with your system)
If you trade with me, you already determine bias from:
Dealer cycle
Structure
EMAs
Time of day
This just asks:
“Is the flow agreeing with my idea?”
How to use currency strength meter
Let’s Apply It to a Real Chart (EURUSD)

What we see on the chart:
Clear downtrend
13 / 50 EMA stacked bearish
Price consistently respecting the EMAs
Lower highs, lower lows
Pullbacks are weak and corrective
This is markdown, not reversal.
Now bring in the Strength Meter:
USD = strong
EUR = weak
That supports the trend.
Not predicts it but confirms it.
What that means for YOU
You are not looking for buys
You are not catching bottoms
You are looking to sell closeouts
Your A+ EURUSD trade
Bias: SHORT only
Ideal entry zone:
Pullback into 13 (orange)–50 (yellow) EMA band
Bonus if it lines up with:
prior structure
previous breakdown level

What you want to see (15m / 30m):
Price pushes up weakly
Wicks rejecting higher
Small consolidation under resistance
Lower high forms
Entry: Break back down out of that base

Stop: Few pips above the pullback high & the EMA rejection
Target:
25–30 pips initial
Extension if momentum continues
What to Remember
Structure gives you the setup.
Strength Meter tells you if there’s flow behind it.
Price action confirms the entry.
You trade structure.
This just tells you if there’s fuel behind it.
That’s it.
Strength follows price. Structure leads price.
What Happens When the Strength Meter Disagrees With the Chart?
This is where most traders get themselves into trouble.
Let’s say:
The chart shows a clean downtrend
Lower highs, lower lows
Price respecting the EMAs
But…
Strength Meter starts showing EUR gaining strength
USD starts dropping
Now what?
Most people panic and either:
Close good trades early
Or worse… reverse into a bad trade
But Remember- Strenght Meter does not lead the move. It reacts to it.
So when the SM shifts, it usually means one of two things:
Scenario 1: Normal Pullback
Price pulls back into EMA
SM shifts slightly
Trend structure remains intact
This is normal and where good trades come from.
You don’t exit.
You don’t flip bias.
You wait for structure to confirm continuation.
Scenario 2: Real Shift in Control
Price breaks structure
Starts holding above EMAs (in a downtrend)
Higher lows begin forming
Strength Meter continues shifting
Now we pay attention.
Because now:
Structure AND flow are changing and that’s when bias changes.
So, here is your Rule
If Strength Meter disagrees but structure is intact → ignore the Meter
If Strength Meter AND structure shift → reassess.
This is the difference between getting shaken out of good trades and holding through normal pullbacks
Most people let indicators control them.
You use them to support what price is already telling you.
One Line to Remember
Structure decides. Strength Meter supports. Price confirms.
Comments