.png)
What Is a Good Win Rate in Forex? The Answer Might Surprise You

Updated: Aug 28
A 90% win rate sounds amazing.
A 50% win rate sounds mediocre.
A 40% win rate sounds like perhaps we should find another hobby.
Except none of those numbers tells you whether a trading method is actually profitable.
You can win 40% of your trades and make money.
You can win 80% of your trades and lose money.
Because win rate is only half the equation.
Let's make this number actually useful.

What Is Win Rate?
Your win rate is simply the percentage of your trades that were winners.
The formula is:
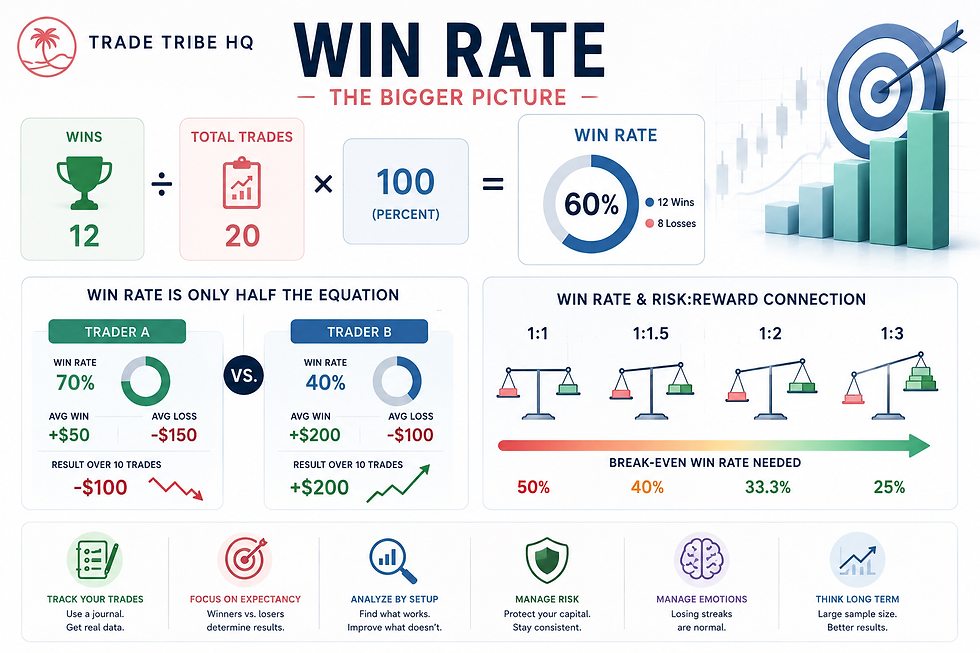
Winning Trades ÷ Total Trades × 100
If you took 20 trades and won 12:
12 ÷ 20 × 100 = 60%
Your win rate is:
60%
Which also means you lost 40% of the trades.
Simple.
The interesting part is figuring out whether that 60% is actually good.
Try the Win Rate Calculator
Enter your number of winning and losing trades to calculate your win rate.
If you've been keeping a trade journal, grab a decent sample rather than calculating it from the three trades you took Tuesday.
Three trades can tell you how Tuesday went.
They cannot tell you whether you have a 67% win-rate trading method.
What Is a Good Win Rate?
There isn't one.
I know. Deeply unsatisfying.
A good win rate is one that works with your average wins and losses to produce positive results over time.
Consider these two traders.
Trader AWins 70% of trades. Average winner: +$50 Average loser: -$150 Over 10 trades, approximately: 7 wins × $50 = +$350 3 losses × $150 = -$450 Net result: -$100 That's a 70% win rate. And a losing result. | Trader BWins only 40% of trades. Average winner: +$200 Average loser: -$100 Over 10 trades: 4 wins × $200 = +$800 6 losses × $100 = -$600 Net result: +$200 Trader B loses more often than she wins. And makes more money. |
That's why asking “What's your win rate?” without asking anything else isn't particularly useful.
Win Rate and Risk-to-Reward Are Connected
The relationship becomes easier to see when we use R-multiples.
If you risk 1R to potentially make 1R: 1:1 risk-to-reward
Your theoretical break-even win rate is: 50%
If your average winner is 2R: 1:2 risk-to-reward
Your theoretical break-even win rate drops to about: 33.3%
At 1:3: 25%
Here's the basic relationship before trading costs:
Average Risk : Reward | Approx. Break-Even Win Rate |
1:0.5 | 66.7% |
1:1 | 50% |
1:1.5 | 40% |
1:2 | 33.3% |
1:3 | 25% |
So a 45% win rate might be terrible for one method and perfectly healthy for another.
Context matters.
High Win Rates Can Be Deceptive
High win rates feel good.
Humans enjoy being right.
Traders REALLY enjoy being right.
This can create some questionable behavior.
For example, imagine a trader who takes tiny profits quickly whenever price moves in her favor.
Winner.
Winner.
Winner.
Winner.
Then one trade moves against her.
Instead of taking the planned loss, she waits.
Then moves the stop.
Then waits some more.
Eventually one giant loss wipes out ten tiny winners.
Her win rate might look fantastic.
Her account does not.
This is why you should never evaluate performance using win rate alone.
Low Win Rates Can Be Emotionally Difficult
The opposite can also happen.
A method might have positive expectancy while losing more often than it wins.
Mathematically, that's perfectly possible.
Emotionally?
That's another conversation.
Imagine a method with a 40% historical win rate.
That means losing trades aren't some unusual failure.
They're the majority of trades.
The method works because the winners are larger.
But if you expect to win constantly, you may abandon a perfectly functional method after four losses because you've decided something is broken.
Understanding your historical win rate helps set realistic expectations.
Losing Streaks Still Happen With a Good Win Rate
Here's another misconception.
A 60% win rate does not mean your trades will conveniently arrive like this:
Win-Loss-Win-Win-Loss-Win
Markets do not organize themselves for emotional comfort.
Results can cluster.
You might see:
Win-Win-Win-Loss-Loss-Loss-Loss-Win
That doesn't automatically mean your win rate changed.
This is one reason you need a meaningful sample.
Sample Size Matters
Suppose you've taken five trades.
You win four.
Your win rate is: 80%
Technically correct.
Now you take another 45 trades.
You win 21 of them.
Your total becomes:
25 wins out of 50 trades
Your win rate is now: 50%
Nothing mysterious happened.
Your original sample was just tiny.
The larger the sample becomes, the more useful your statistics become for understanding how your method actually behaves.
There's no magical number where your data suddenly becomes perfect, but generally:
5 trades = anecdote
20 trades = starting to learn something
50+ trades = much more useful
100+ trades = now we have something worth studying
And even then, market conditions change.
Statistics are evidence, not prophecy.
Track Your Forex Win Rate by Setup
This is where win-rate data can become genuinely useful.
Instead of only calculating your overall win rate, start looking deeper.
Maybe your overall win rate is:55%
But then you discover:
Setup A: 68%
Setup B: 61%
Setup C: 32%
Well.
Hello, Setup C.
We should probably talk.
You can also track results by:
currency pair
session
setup type
day of the week
market condition
entry style
trade management method
Now win rate becomes a diagnostic tool rather than a scoreboard.
Don't Chase a Higher Win Rate
This is an easy trap.
You calculate your win rate.
It's 52%.
You decide you want 70%.
So you start changing things specifically to eliminate losing trades.
You take profits earlier.
Skip trades after losses.
Move stops.
Avoid valid setups because you're afraid they'll lower your percentage.
Now you're optimizing for being right, not necessarily for making money.
Those are not the same objective.
A better question is:
Does my combination of win rate, average winner, and average loser produce positive expectancy?
That's what actually matters.
Win Rate Doesn't Tell You How Much You're Making
Suppose your win rate is 60%.
Good.
Now I ask: How large is your average winner?
You don't know.
How large is your average loser?
Also don't know.
Then your 60% doesn't tell us very much.
This is why performance statistics work best together.
At minimum, you want to understand:
Win Rate
How often do I win?
Average Winner
How much do I typically make when I'm right?
Average Loser
How much do I typically lose when I'm wrong?
Expectancy
What does an average trade theoretically produce?
Profit Factor
How much gross profit am I generating compared with gross losses?
Now we can actually evaluate something.
Your Win Rate Doesn't Need to Impress Anyone
There's a weird tendency in trading to treat win rate like a grade.
95%? A+.
70%? Respectable.
42%? Please see me after class.
That's nonsense.
Your trading statistics aren't there to make you look impressive.
They're there to tell you how your method behaves.
If a method wins 43% of the time and has strong positive expectancy because the winners are substantially larger than the losers, then 43% isn't a bad win rate.
It's simply the method's win rate.
Your job is to understand it.
Use Win Rate to Set Expectations
This may actually be the most useful application.
If your historical data tells you your method wins around 55% of the time, you know losing trades are normal.
Not rare.
Normal.
That changes how you interpret an individual loss.
Instead of: “The method stopped working.”
you can ask: “Is this result still within the normal behavior of the method?”
That is a much better question.
And considerably cheaper than redesigning your entire trading plan every Thursday.
Use the Calculator With Your Journal
The Win Rate Calculator above becomes much more useful once you have actual trade data.
Take a sample of your trades.
Enter: Total winners and Total losers
Calculate your win rate.
Then don't stop there.
Compare it with your average winner, average loser, risk-to-reward, expectancy and profit factor.
Those numbers together tell the story.
Win rate alone is just one character.
Keep Learning
Next, use the Break-Even Win Rate Calculator to see how often you theoretically need to win based on your average risk-to-reward.
Then explore the Trade Tribe HQ Resources section for the Trade Expectancy Calculator, Profit Factor Calculator, R-Multiple Calculator, Losing-Streak Risk Calculator, and Trade Journal Stats Calculator.
Once you start looking at these numbers together, trading performance becomes considerably less mysterious.
And you'll stop asking whether a 60% win rate is good.
You'll start asking whether it's profitable with the rest of your numbers.
Much better question.
And now you know What Is a Good Win Rate in Forex? Did The Answer Surprise You?
Educational purposes only. Forex trading involves risk. Historical win rates and performance statistics do not predict future results. Examples are simplified for educational purposes and may not include spreads, commissions, slippage, execution differences, or changing market conditions.


Comments