.png)
How Much Your Winners Are Actually Making Compared to Your Losers: Profit Factor Calculator

Your winning trades made $6,000. Your losing trades cost you $4,000. You're up two grand, and that's usually where we stop looking.
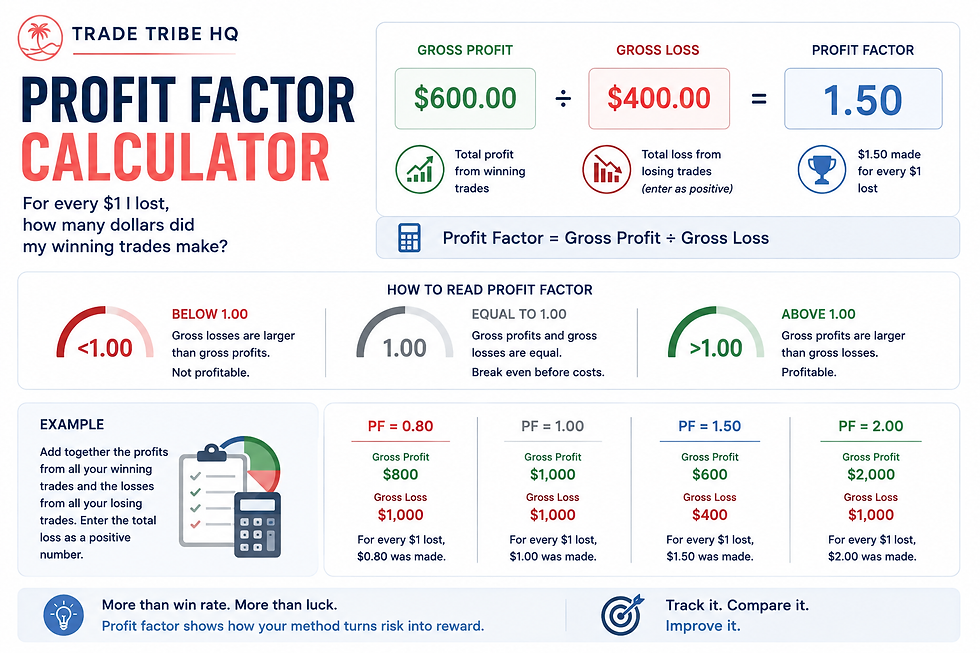
Divide instead of subtracting and you get something more useful. $6,000 ÷ $4,000 = 1.50. For every dollar your losers cost you, your winners brought back a dollar fifty. That's your profit factor. It's one number, it comes straight out of your journal, and it tells you more about whether a method is working than almost anything else you can pull in under a minute.

Gross profit is every winning trade added together, before you take any losses out. Winners of +$100, +$75, +$200, +$50 and +$125 give you $550.
Gross loss is every losing trade added together, as a positive number. Losses of -$50, -$75, -$100 and -$25 give you $250.
$550 ÷ $250 = 2.20. Your winners generated $2.20 for every dollar your losers took.
The positive number thing trips people up. Your journal shows losses as negatives because that's what they were. You flip the sign for this calculation. 550 divided by negative 250 gives you negative 2.2, which isn't a thing anybody has ever had.
Use the Profit Factor Calculator
You can run this in dollars or in R, as long as both boxes use the same unit. More on R further down.
What the number is telling you
Above 1.00 means your gross profits were bigger than your gross losses over that batch of trades.
Exactly 1.00 means they cancelled each other out. You made money and gave the same amount back.
Below 1.00 means your losses were bigger. A 0.80 means your winners only brought back 80 cents for every dollar lost.
That's before costs, unless your journal already has commissions and spread baked into each trade result. Most journals don't unless you set them up that way, so a 1.05 on paper can quietly be a 0.98 in real life.

There's no good profit factor, and I wish there were
People want a target number. There isn't one, which is annoying, because it would've been really convenient.
What you can read is the cushion. A 1.02 is technically above break even, but there's nothing underneath it. Slightly worse fills, a wider spread during news, one bad week, and it's under water. A 1.50 has some room in it. A 2.00 means your winners doubled what your losers took.
But a 1.5 across 800 trades is worth a hell of a lot more than a 4.0 across twelve, so the size of the number matters less than the size of the sample it came from.
Your win rate isn't in there at all
This is the part I'd want somebody to tell me first, because "what's your win rate" is the question everybody asks and it's close to useless on its own.
Ten trades. Four winners averaging +$200, six losers averaging -$50. Gross profit $800, gross loss $300. Profit factor 2.67. You lost more trades than you won and you're doing great.
Flip it. Ten trades, eight winners averaging +$25, two losers averaging -$150. Gross profit $200, gross loss $300. Profit factor 0.67. You were right 80% of the time and you lost money.
Same ten trades either way. The wins and the losses don't get one vote each, they get weighted by size, and win rate throws that information away.
A small sample will lie to you and it will sound confident
Say you've taken five trades. Four winners, one tiny loser. Profit factor 8.7.
Five trades tells you nothing. One normal-sized loss would drop that to something ordinary. This is where the screenshots come from, the ones with the enormous number and no trade count anywhere on the image.
Trader A has 10 trades and a 2.5. Trader B has 300 trades and a 1.8. Trader B's number is lower and it's worth more, because we've watched it survive 290 more trades.
One huge winner can be carrying the whole thing
Gross profit $5,000, gross loss $2,000, profit factor 2.5. Looks excellent.
Then you go look and one single trade produced $3,500 of that $5,000. Take it out and you've got $1,500 gross profit against $2,000 gross loss. Profit factor 0.75.
You don't delete the trade. It happened, it's real, it belongs in your results. But now you know the whole result is leaning on one trade, and you know to ask how often those show up. If your method is specifically built to catch occasional huge winners, that's the strategy working, and pulling them out would misrepresent it. You'd just also want to know what the flat stretches look like in between.
Run it both ways sometimes, with your biggest winner and without. It's a stress test, not a rewrite of your numbers.
The same thing happens in reverse. A method that's been perfectly ordinary for 50 trades takes one -5R because you moved a stop, and your profit factor gets hammered. That's not the setup failing. That's your execution showing up in the data, which is arguably the more useful finding.
What it doesn't tell you
Profit factor is a ratio, so a bunch of things vanish inside it.
How much money you made. A strategy with $200 gross profit and $100 gross loss has a 2.0. A strategy with $15,000 and $10,000 has a 1.5. The second one made $5,000.
Account size. A 1.8 looks identical whether it came off a $500 account or a $500,000 one. That's actually why it's handy for comparing methods, but it means the number alone can't tell you what your trading is worth.
Drawdown. Two strategies both sitting at 2.0, one with an 8% max drawdown and one with 35%. Same number, completely different experience.
Losing streaks. Two 1.8s, one where the longest losing run was 4 trades and one where it was 12. The second one is going to make you question your entire life around trade nine.
How often you trade. 2.0 across 10 trades a year versus 1.6 across 200.
Whether you can actually trade it. A 2.3 with a 30% win rate, long dry spells and trades that run three weeks is mathematically lovely and might be completely wrong for you. A strategy only works if you can execute it, and you can't execute one you hate.
Expectancy answers a different question
These two get confused constantly.
Profit factor asks how much gross profit you made for every dollar of gross loss. Expectancy asks what the average single trade was worth.
Profit factor 1.7 tells you the winners outweighed the losers by a decent margin. It doesn't tell you whether that took 20 trades or 500. Expectancy of +0.30R tells you what one trade is worth on average, so you can multiply it out. Together they're much stronger than either one alone.
Dollars or R
R is just one unit of risk. If you risk $50 on a trade, that trade's R is $50, and a winner that made $150 is a +3R.
Why bother: say you backtest 200 trades. The early ones risked $10, the later ones risked $50. Calculate in dollars and the later trades dominate your profit factor purely because they were bigger, not because they were better. Calculate in R and every trade gets equal weight, so you're measuring the method instead of the position sizing.
So for testing a method, use R. For measuring what your actual account did, use dollars. Both are worth having.
Where it actually gets useful: break your journal apart
One profit factor for your whole trading history is a starting point, not the answer. The good stuff shows up when you calculate it in groups.
By setup. Setup A comes back 2.10, Setup B 1.45, Setup C 0.72. Setup C is giving back more than it makes.
By pair. EUR/USD 1.90, GBP/USD 1.40, USD/JPY 0.85. Now you have something to investigate instead of "I swear USD/JPY hates me." It doesn't. It has never heard of you.
By session. London 1.85, New York 1.10, and the random trades you took outside your normal hours because you were bored, 0.54.
By direction. Longs 1.8, shorts 1.1. Maybe your short rules need work, maybe the sample was in an uptrend the whole time.
By rule-following. Trades that followed your plan, 2.0. Trades where you freelanced, 0.6. This one is educational in a way that stings.
Before you throw Setup C in the ocean, check a few things. How many trades is it actually built on? Twelve isn't a verdict. Were you taking it in the conditions it was designed for? Did half those losses break your own entry rules? A statistic tells you where to look. It doesn't tell you what to do about it.
Rolling profit factor
Instead of only running your whole history, run the last 20, the last 50, the last 100.
If your lifetime number is 1.7 and your last 50 trades come back 0.9, something moved.
Could be market conditions, could be you got sloppy, could be you quietly changed your exits two months ago. The number won't tell you which. It just points at the window.
Don't panic over the last 10 trades though. Ten trades is noise. Compare a bad stretch against your normal losing streaks and your usual drawdown before you decide the method is dead.
Costs eat this number
Gross profit $6,000, gross loss $4,000, profit factor 1.5. Then you remember the $800 you paid in commissions and spread. That's not in the ratio anywhere.
It matters most for small targets. If your average winner is 5 pips, a 1-pip cost is a fifth of the trade. If your average winner is 100 pips, the same cost barely registers. Two strategies can look nearly identical before costs and be miles apart after.
Whatever you decide, be consistent. If one sample includes costs, the other one has to as well, or you're comparing two numbers built on different assumptions.
Don't chase a bigger number
Once we find a metric we like, we tend to immediately ruin it.
Backtest 500 trades, profit factor 1.6. Add a filter, now it's 200 trades at 1.9. Add another, 80 trades at 2.4. One more, 25 trades at 4.8.
Congratulations, you've built a set of rules that perfectly describes the past and predicts nothing. That's overfitting, and it happens just as easily by cherry-picking setups, quietly dropping ugly trades from a backtest, or changing the rules halfway through testing.
An honest 1.4 that accurately describes what your trading actually does is worth more than a beautiful 3.0 you assembled through creative accounting. You can't trade the pretty one.
Go run it
Pull your journal. Add up every winner, add up every loser as a positive, put both numbers in the calculator above. Write down what comes out.
Then do it again by setup. Then by pair, then by session. That's the point where a journal stops being a scrapbook of screenshots and starts telling you where your money is actually coming from, and where it's leaking out.
Educational purposes only. Forex trading involves risk. Profit factor is a historical performance statistic based on the data entered and does not predict future results. Results can be affected by sample size, outliers, spreads, commissions, slippage, execution, and changing market conditions.


Comments