.png)
Trade #1: EUR/USD Trade Breakdown, Wrong Way First, Then +54 Pips

The $10K Prop Account Experiment
This is the first trade on the account, and a full EUR/USD trade breakdown of how it went from wrong to +54 pips. It started with me being wrong, there was a misclick in the middle, and it ended with me asleep while price did exactly what I'd planned for.
I checked the chart five times that day -costing me a whopping 30 min at the computer. Here's what I saw each time, in order.
New here? Start with the opening post for the rules and the setup.
Account Snapshot
Starting balance: $10,000
Balance after: $10,528.63
Profit target progress: 5.3% of 10%, a little over halfway
Worst floating drawdown on the trade: 8.9 pips (about $88)

The EUR/USD Trade Breakdown
11am: The Open
11am in Hawaii is when the new trading day opens (5pm New York), so that's my first look.
The previous day had pushed down to a low, below every one of my EMAs, and then climbed back up into a channel. No trade yet. I just wanted to know where we were starting from.

3pm: First Check
Price dipped, bounced off the 200 EMA (the teal line), and broke above the setup channel to make a new high.
That's when I started marking things up. I drew the channel of interest in blue, because I was leaning long, and the MW Apex/Nadir channel in orange. That zone became my area of interest for the night.

7pm: Second Check, and the Short
By 7pm the picture had shifted. Price had pushed above the setup channel, fallen back through it, and was retesting it from below. It had formed an M and was retesting the Nadir of that second M.
That fast move to the top followed by a retest from underneath read like a short to me. Maybe not a big one, but at least a small move. So I entered short with a 10-pip stop and a 20-pip target, and kept an eye on it.
Yes, I was leaning long four hours earlier. Hold that thought.

9pm: Third Check
Price dropped below the channel and formed a new one. Another retest of the M Nadir from below kept me thinking short, so I stayed in. But I was watching closely now.
Here's why. That was now three pushes down, and price was 27 pips off the high. Three pushes into a low, with that much distance from the top, is a classic trap. Anyone shorting the breakdown is about to be stuck. In other words, my short was turning into a perfect setup for the other direction.
9pm here is also London open, and the London open is the exact timing the Dealer Cycle tells you to watch.

9:15pm: Flipping Long
And that's what happened. Price blew straight through the L2 Nadir, the level my short depended on. The setup was invalidated.
So I closed the short at breakeven and entered the other way.
The Misclick
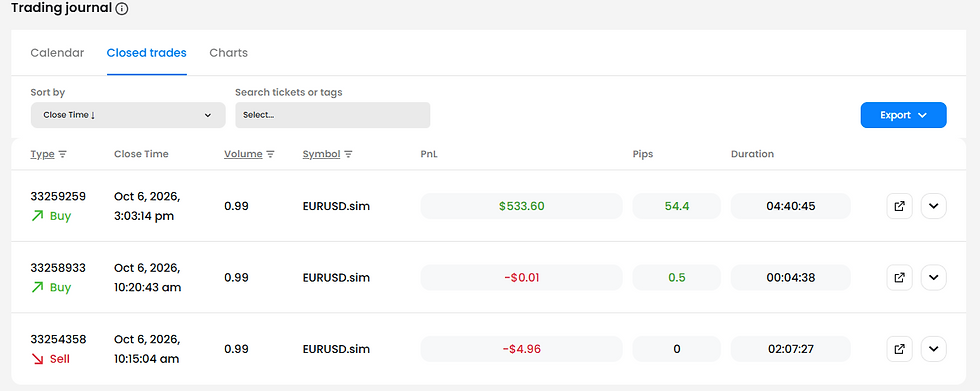
If you look at my trading journal, you'll see three tickets that night, not two. The middle one is a buy that lasted four minutes and closed at -$0.01.
That was a misclick. I was setting up the long, wasn't ready to send it yet, and it went through anyway. So I closed it, waited until I saw what I was looking for, and then entered for real.
That's how you're supposed to handle it. Mistakes happen. A misclick is only a problem if you leave it open and talk yourself into keeping it because now you're "in the trade." Mine cost one cent.
The Trade
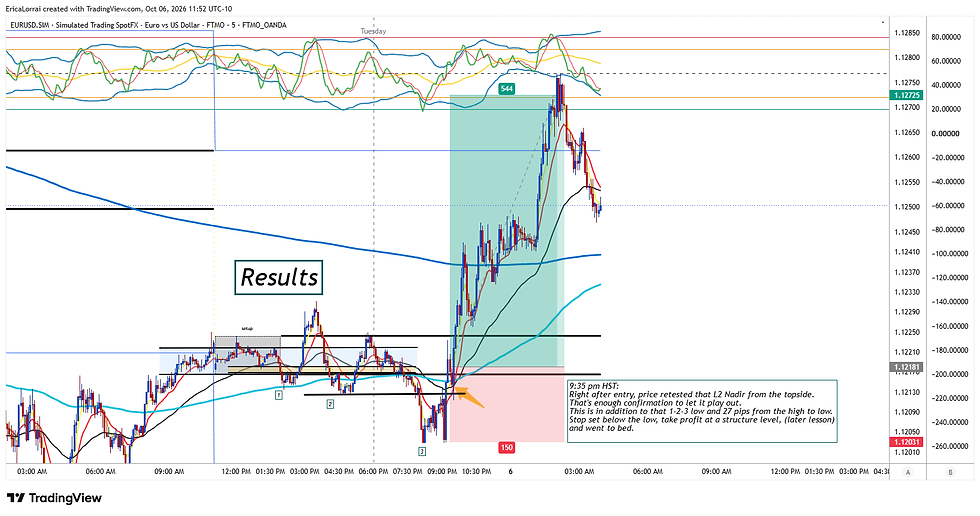
Pair: EUR/USD, long Entry: 1.12202 Stop: 1.12043 (15.9 pips) Target: 1.12742 (54 pips) Size: 1.5%, 0.99 lots, risking about $157
The stop went below the low of that third push. That low was where the market had already run stops, so my stop was sitting behind the trap instead of at some random number.
For the target, I went back to a previous structure high, an area from earlier in the week that price hadn't cleared out. A 20-pip goal would have worked too, but I wanted the structure level. (There's a lesson coming on how I place these. Later post.)

9:35pm: Confirmation, Then Bed
Right after entry, price came back down and retested the L2 Nadir, this time from above. The level that had been resistance was now acting as support.
That retest is also where my 8.9 pips of drawdown came from. Against a 15.9-pip stop, price used more than half my risk before the trade worked.
This is the part that disappears when people post trades after the fact. The finished chart looks like a clean move up. While it was happening, that trade was 56% of the way to a loss.
But a retest from the topside is exactly what I wanted to see. Add that to the 1-2-3 low and the 27-pip drop from high to low, and that was enough confirmation to let it play out.
So I went to bed.
2am: Take Profit
It hit my target at 2am, around the New York pre-open, while I was asleep. 54.4 pips, +$533.60. One trade covered more than half the prop firm profit target.

Honestly, the TP felt too close for comfort. I could see price reaching for that zone and wanted more room. But look at what happened after: price topped out at exactly my target and then fell about 30 pips. If I'd gotten greedy and pushed the target higher, I wouldn't have been filled, and I'd have woken up to a much smaller win.
The Numbers
Risk: 15.9 pips / $157
Reward: 54.4 pips / $533.60
R-multiple: 3.4R
Risk-to-reward: 1:3.4
I made 3.4 times what I put at risk.
What I'd Keep / What I'd Change
Keep: Checking in at set times instead of staring at the chart all day. Watching an open trade for signs it's wrong. Recognizing when my own trade had turned into someone else's trap, and flipping. Putting the stop behind the stop hunt. Setting it up and leaving it alone.
Change: Maybe trust my first read a little more. I was leaning long at 3pm, and the market ended up agreeing with me. Is it a lesson or just hindsight?
On to Trade #2.




Comments