.png)
Pip Difference Calculator: How Many Pips Are Between Two Prices?

You got into EUR/USD at 1.1725. Price is sitting at 1.1768 now. How far did it move? That one's 43 pips and you probably did it in your head before you finished reading the sentence.
Then you switch over to USD/JPY and the decimals are in a completely different place. Or your broker shows you 1.08647 instead of 1.0864 and now there's a fifth digit doing something you're not sure about. Or you're trying to measure six separate legs of a move on a chart, in a row, and by the fourth one your brain has quietly decided that decimals are no longer its department.
That's the whole job of this calculator. Two prices in, distance in pips out.

What the pip difference calculator is actually measuring
A pip is just a unit of distance. It's the standard tick that forex prices are quoted in, so instead of saying "price moved 0.0043," everyone says 43 pips and we all know what we mean.
For most pairs, one pip sits at the fourth decimal place. 0.0001. EUR/USD from 1.1700 to 1.1750 is 50 pips.
For JPY pairs, one pip sits at the second decimal place. 0.01. USD/JPY from 147.50 to 148.00 is also 50 pips. Same distance, completely different-looking number, because the yen is quoted in bigger chunks. That's it, that's the whole reason. Nothing deeper is going on.
The calculator asks for the pair first so it knows which of those two rules to apply, and then it subtracts. That's all it's doing. You could do it by hand, and honestly for round numbers you should, because getting a feel for pip distances by eye is a skill worth having. But when you're measuring twelve things during a backtest you will make an arithmetic mistake at some point, and it'll be the one you build a rule on.
Try the Pip Difference Calculator
Enter your currency pair, starting price, and ending price. The calculator will show the pip difference and, when direction is included, up or down.
The fifth decimal is where everybody gets tripped up
Most platforms now quote to five decimals on regular pairs and three on JPY pairs. EUR/USD shows up as 1.17005. USD/JPY as 147.205.
That last digit is a tenth of a pip. It's called a pipette, or a fractional pip, and nobody says either of those words out loud, they just say "point five."
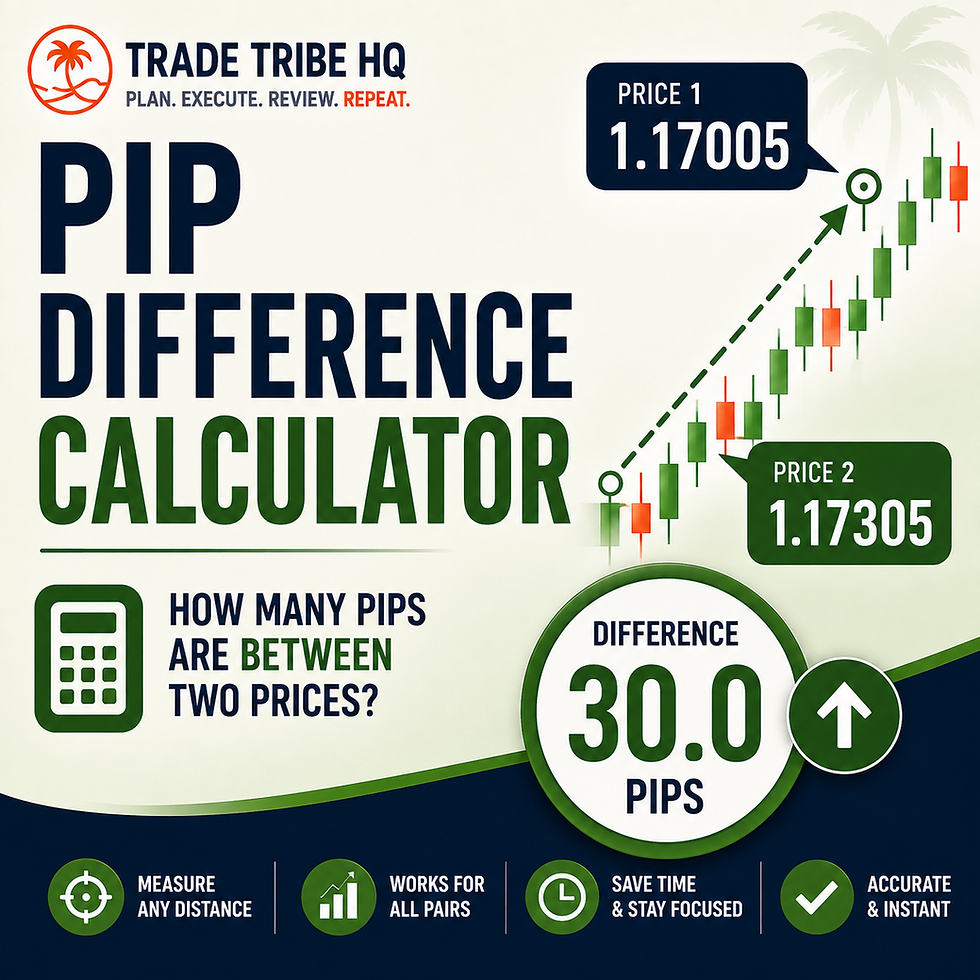
So if price moves from 1.17005 to 1.17305, the raw difference is 0.00300, and that's 30 pips. Not 300. If you've ever measured a move and gotten a number ten times bigger than felt right, this is why.
Where it actually matters is on the messy ones. 1.08647 down to 1.08392 is a difference of 0.00255, which is 25.5 pips. That half pip is not going to change your life, but if you're recording fifty trades and rounding every one of them in whatever direction feels tidy, your averages start drifting. The calculator keeps the half instead of rounding it away.
Distance is not the same as profit
The pip difference between two prices doesn't know or care which way you were positioned. Price drops 40 pips from your entry. If you were short, that's 40 pips in your favour. If you were long, that's 40 against you. The distance is identical.
Then there's the gap between what the chart shows and what your account shows. Spread, commission, and slippage all live in that gap. If your chart says the move was 30 pips, your fill was probably a bit worse than the chart price on the way in and possibly on the way out too, so your actual result is 30 pips minus whatever the costs were.
For measuring the market, use chart prices. For measuring you, go into your platform and use the actual executed prices from the trade. Those are two different jobs and mixing them up is how people end up with a journal that says they're profitable when they aren't.
The other half of turning pips into money is the pip value calculator. If a move is 35 pips and each pip is worth $2 on your position size, that's roughly $70. Pip difference gives you the distance, pip value gives you what one unit of that distance is worth, and you multiply. That's the whole relationship.
Measure the stop first, then pick the size
This is the one I want you to actually take away from here.
You find a setup. You look at the chart and ask where price would have to go for this idea to be wrong, and that spot is your stop. Say your entry is 1.1740 and the level that invalidates the trade sits just under 1.1715. Run those two prices and you get 25 pips.
Now, and only now, you go to the position size calculator. You tell it your account, your risk, say $20, and that 25-pip stop, and it tells you how big the position can be. The stop distance is an input. The lot size is the output.
What people do instead is decide they want to trade half a lot because that's what they traded last time, and then go looking for somewhere to cram the stop that lets them keep that size. Which is how you end up with a stop sitting six pips from entry in the middle of a range, getting clipped by noise, over and over, and then deciding the strategy doesn't work. It's not the strategy. It's that the position size got to vote on stop placement and it should never have had a fucking say.
Chart decides the stop. Risk decides the size. In that order, every time you take a trade.
Then the target, and then your R
Same tool, other direction. Entry 1.1700, target 1.1765, that's 65 pips.
Stop was 25. So 65 divided by 25 is 2.6, and you're looking at roughly 1:2.6 risk to reward before costs. You knew that before you clicked anything, which is the point of measuring it.
That ratio is also how you get to R. R is just your risk on the trade, expressed as one unit. Your stop was 20 pips, you made 40, that's +2R. You made 10, that's +0.5R. You got stopped, that's -1R. Doesn't matter what the pair was or how big the position was, R makes every trade comparable to every other trade.
Pips tell you how far price went. R tells you what that distance was worth relative to what you put at risk to get it. Log both.
What you caught versus what was there
Here's where measuring distances stops being homework and starts telling you things.
Two numbers, and they're the ones almost nobody tracks. MFE is maximum favourable excursion, which is the furthest price went in your favour while the trade was open. MAE is maximum adverse excursion, the furthest it went against you before the trade closed.
So: you're long from 1.1700. Price runs up to 1.1760 before it rolls over. You exited at 1.1725. Your MFE was 60 pips. You captured 25. The trade offered you more than twice what you took.
One trade like that means nothing. Thirty of them means your exits need looking at.
And on the other side, say you go back through a hundred winning trades and measure how far each one dipped against you before it worked. Entry 1.1700, price wobbles down to 1.1688, that's 12 pips of adverse movement on a trade that ended up winning. If most of your winners never went more than about 12 pips against you and your stop is routinely sitting 40 pips out, that's worth knowing. It doesn't mean go move your stop to 12, because your losers and the actual structure of the chart still get a say. It means you've found a real question to investigate instead of a vibe.
Ranges, so you know what normal looks like
Asian session high 1.1720, low 1.1690, that's a 30-pip range. London then runs from 1.1690 up to 1.1750, 60 pips. Daily high 1.1785 and low 1.1710 gives you 75 pips on the day.
Do that for a few weeks and you stop saying "Asia was tight" and start saying "Asia was 30, which is about half of what it usually is." One of those is an impression. The other one is data, and you can build on data.
This pairs directly with the ADR calculator. If EUR/USD averages 80 pips a day and today's high-to-low is already 72, price has covered about 90% of its typical daily distance. That's not a ceiling, days blow through their average all the time, but it's useful context when you're deciding whether to chase a breakout at 3pm.
Where it gets genuinely interesting
Once measuring is fast, you can start quantifying the shape of things instead of describing them.
Take a move you keep seeing. First push, 42 pips. Pullback, 18. Second push, 37. Pullback, 21. Third push, 31. That's a completely different piece of information than "it pushes and pulls back a few times." You can see the pushes shrinking. You can see the pullbacks holding roughly steady.
Then run the same setup fifty times through your backtest and measure the same three points every time. Maybe the average initial move comes out at 38 pips, the average pullback at 17, the average extension at 34. Now when you say the setup usually pulls back a little before continuing, you actually know what "a little" has historically meant, and you can size a stop around it.
You can do this with trades you didn't take, too. You spotted the setup, talked yourself out of it, and price went 60 pips your way. Measure it and record it, it's still valid research. Just keep those in a separate column from your real trades so you're not quietly awarding yourself imaginary money.
So
Entry price, exit price, stop distance, target distance, MFE, MAE, R. Seven numbers per trade, and six of them come from this calculator. It's the least glamorous tool on the resources page and it's the one feeding almost everything else.
Go pull up a chart, pick yesterday's high and low, and measure it. Then measure the day before. Do that five days in a row and you'll know more about how your pair actually moves than you did last week.
Educational purposes only. Forex trading involves substantial risk. Pip-difference calculations measure price distance and do not by themselves represent actual profit or loss. Actual results may differ because of spreads, commissions, slippage, execution, and instrument specifications.


Comments